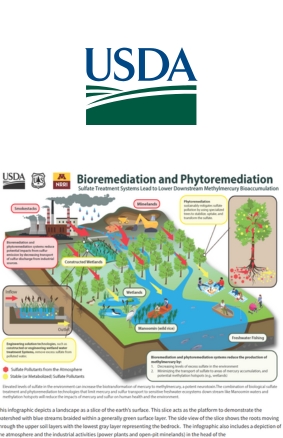
The USDA Forest Service NRS multimedia hub features a collection of science-based infographics that illustrate forest and ecosystem topics. Examples include visuals on bioremediation and phytoremediation—showing how trees like poplars and willows can clean polluted water—and mercury and sulfur cycling in forest watersheds, depicting pollutant pathways and ecological risks.
Science mapping: Students analyze the “Bioremediation & Phytoremediation” infographic to identify key elements—pollutant source, plant uptake, and ecosystem outcomes.
Flow-chart creation: Using the “Mercury & Sulfur” visual, they draft a detailed diagram of pollutant fate—from industrial emissions to water contamination.
Local adaptation: Apply infographic concepts to Hawaiʻi issues—such as contamination in watersheds—and propose native planting solutions.
STEAM poster challenge: Teams design an original infographic showcasing a local forest or watershed topic (e.g., invasive species control, carbon sequestration), using USDA templates for guidance.
Phytoremediation: use of plants to remove or stabilize pollutants
Pollutant cycling: movement of mercury and sulfur through air, soil, water, and food webs
Ecological health literacy: understanding ecosystem services and contamination pathways
Visual science communication: interpreting data graphic design and synthesis
STEAM integration: merging science content with creative expression and local relevance